
Back to Blog
How to Analyze Market Trends Like an Expert
Learn how to analyze market trends with proven strategies. This guide covers data gathering, tools, and turning insights into business growth.
Oct 18, 2025
generated
Analyzing market trends is all about connecting the dots. It’s a systematic process of gathering data on what customers are doing and how the economy is shifting, then interpreting that information to spot patterns. It’s not just about knowing what is happening, but understanding the why behind it.
Your Starting Point for Effective Trend Analysis
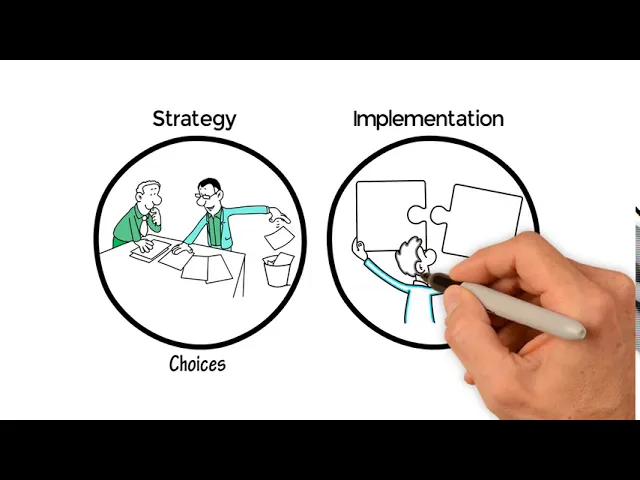
Before you dive headfirst into a mountain of spreadsheets and analytics, let's get grounded on what market trend analysis actually is. It's not about having a crystal ball to perfectly predict the future. Instead, it’s about understanding the present so deeply that you can make some really smart guesses about what's coming next. A solid analysis shows you where your industry is headed, what your customers are really looking for, and how your competitors are playing the game.
To really get a feel for market dynamics, you need to start with the basics. This is where something like a general guide on how to analyze data comes in handy, giving you a solid foundation so you can move past just surface-level observations. The best analysis isn’t a one-and-done report; it’s an ongoing habit of staying curious and seeing connections that others might miss.
Core Components of Analysis
The whole process really boils down to three core areas you need to watch:
Broad Economic Shifts: You have to understand the big picture. Things like inflation rates or global supply chain hiccups provide the context for everything else that happens in your market.
Consumer Behavior Insights: This is where the gold is. You need to dig into what your customers need, what they prefer, and what their biggest pain points are. This data tells you what people are actively trying to solve.
Competitor Positioning: Keeping an eye on how your rivals are adapting gives you a clear benchmark. More importantly, it helps you spot the gaps in the market that you can swoop in and fill.
This infographic breaks down the flow perfectly, showing how you start with those macro-level economic factors and drill down to specific competitor moves.
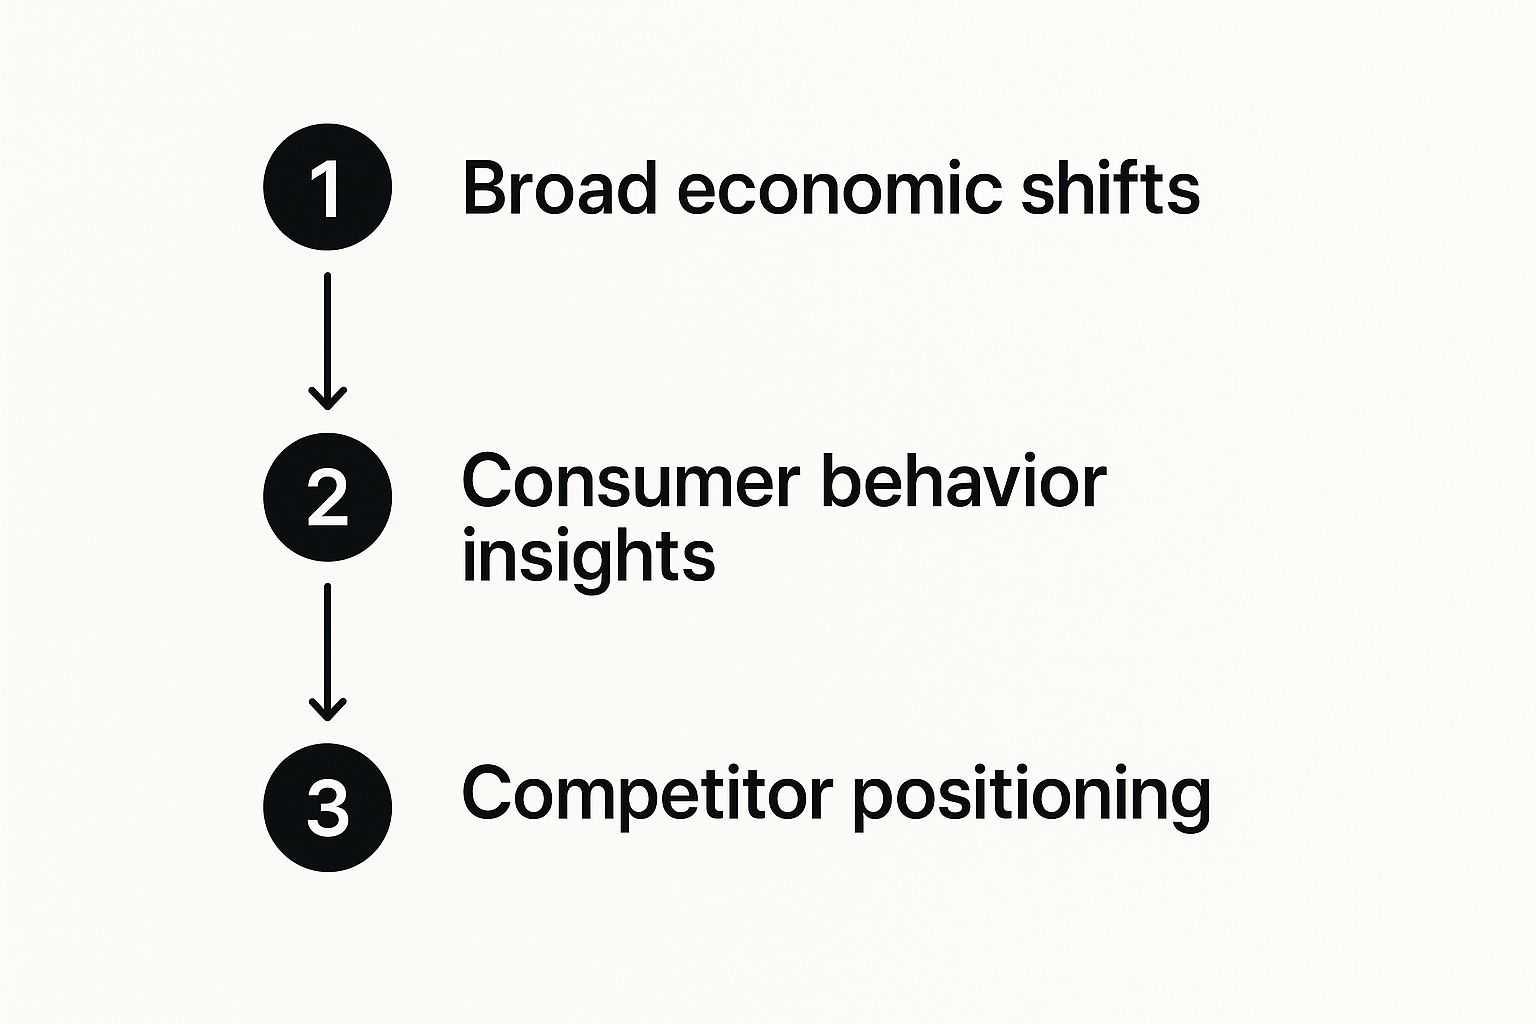
As you can see, a proper analysis starts broad before you narrow your focus. This structured approach is what keeps you from getting distracted by short-lived fads and helps you zero in on the sustained shifts that actually matter.
Key Takeaway: The most powerful insights come from layering these different data types on top of each other. For example, a change in how people are spending their money (consumer behavior) might be a direct result of rising interest rates (economic shifts), which in turn forces your competitors to start offering new payment plans (competitor positioning). See how it all connects?
Gathering Your Data From Macro to Micro

Any market analysis you do is only as good as the data you feed it. This is where we get our hands dirty and move from theory to actual legwork. I like to think of it as building a case like a detective; you need clues from all over the place to see the full picture.
A solid analysis means looking at two completely different levels of information. We’ll start with the 30,000-foot view before we zoom all the way in on the details that hit your business directly.
Starting With the Macro View
The macro level is all about the big stuff: broad economic trends, global industry reports, and even geopolitical shifts that affect everyone. This is your "weather forecast" for the business world, and it gives you critical context for everything else you uncover. Trying to navigate without it is like setting sail without a compass.
For instance, you absolutely have to keep an eye on global economic indicators. The International Monetary Fund (IMF) is projecting global growth to be around 3.0% for 2025 and 3.1% in 2026, thanks to a mix of policy changes and global jitters. These aren't just abstract numbers; they directly impact consumer spending, supply chains, and investment climates. You can dig into the specifics in the IMF's World Economic Outlook.
Key Takeaway: Macro trends set the entire stage. A rising economic tide can lift all boats, but a downturn can create serious headwinds for even the best products. Your first job is to figure out which way the wind is blowing.
Zooming Into the Micro Details
Once you have the big picture sorted, it's time to bring out the microscope. The micro level is where you gather data specific to your customers, your competitors, and your own business operations. This is the stuff that's immediate, tangible, and directly actionable.
Here, you're gathering intel from sources much closer to home. These data points give you the specifics needed to make tactical moves and check if the assumptions you made from the macro view actually hold up in the real world.
So, where do you find this gold?
Customer Surveys and Feedback: There's no substitute for hearing directly from your customers. Tools like SurveyMonkey or even a simple Google Form can give you a direct line into their pain points, what they love, and where you're falling short.
Social Media Listening: Platforms like X (formerly Twitter), Reddit, and Instagram are treasure troves of raw, unfiltered consumer opinions. Keep an ear to the ground for conversations about your brand, your competitors, and the industry in general. You’ll spot trends before they become obvious.
Competitor Analysis: You have to know what your rivals are up to. Are they launching new products? Running aggressive new ad campaigns? Changing their pricing? This intelligence shows you how they're reacting to the same market pressures you are.
Your Own Sales Data: Honestly, one of your most powerful assets is sitting right in your own database. Dive into your sales figures to see which products are flying off the shelves, which regions are outperforming others, and if there are any seasonal patterns you can capitalize on.
As you get more advanced, you can even explore specialized tools like Kyve's Data Pipeline, a Web3 No-Code Data Gateway to pull in diverse data streams more efficiently. By systematically gathering both macro and micro data, you get a complete 360-degree view, turning scattered information into real strategic intelligence.
Choosing the Right Tools for Your Analysis
Okay, you've gathered a mountain of data. Now what? The real challenge isn't just having the information; it's turning that raw data into insights you can actually use. Staring at spreadsheets for hours is a surefire way to miss the forest for the trees. This is where building a modern toolkit comes in, and thankfully, it doesn’t have to cost a fortune.
Your goal is to assemble a set of tools that handles the grunt work of data collection and visualization. This frees you up to do the important stuff: figuring out what the market is telling you and crafting a winning strategy.
Free and Foundational Tools
You can get surprisingly far without spending a single penny. Some of the most powerful tools out there are completely free and form the bedrock of any solid analysis.
Google Trends: This is my go-to starting point. It’s perfect for getting a quick read on public interest in a product, brand, or even just an idea over time. You can visually spot seasonal spikes and see what's gaining traction long before it hits the mainstream.
Social Media Analytics: Every platform, from Instagram to LinkedIn, has its own built-in analytics dashboard. Don't sleep on these. They give you a direct line to your audience's demographics, engagement, and the content that's actually hitting the mark. It's a goldmine for spotting subtle shifts in what people want.
Your CRM: Seriously, you're already sitting on a treasure trove of data. Your Customer Relationship Management (CRM) system is tracking every purchase, customer chat, and sales cycle. This is where you'll find buying patterns unique to your audience.
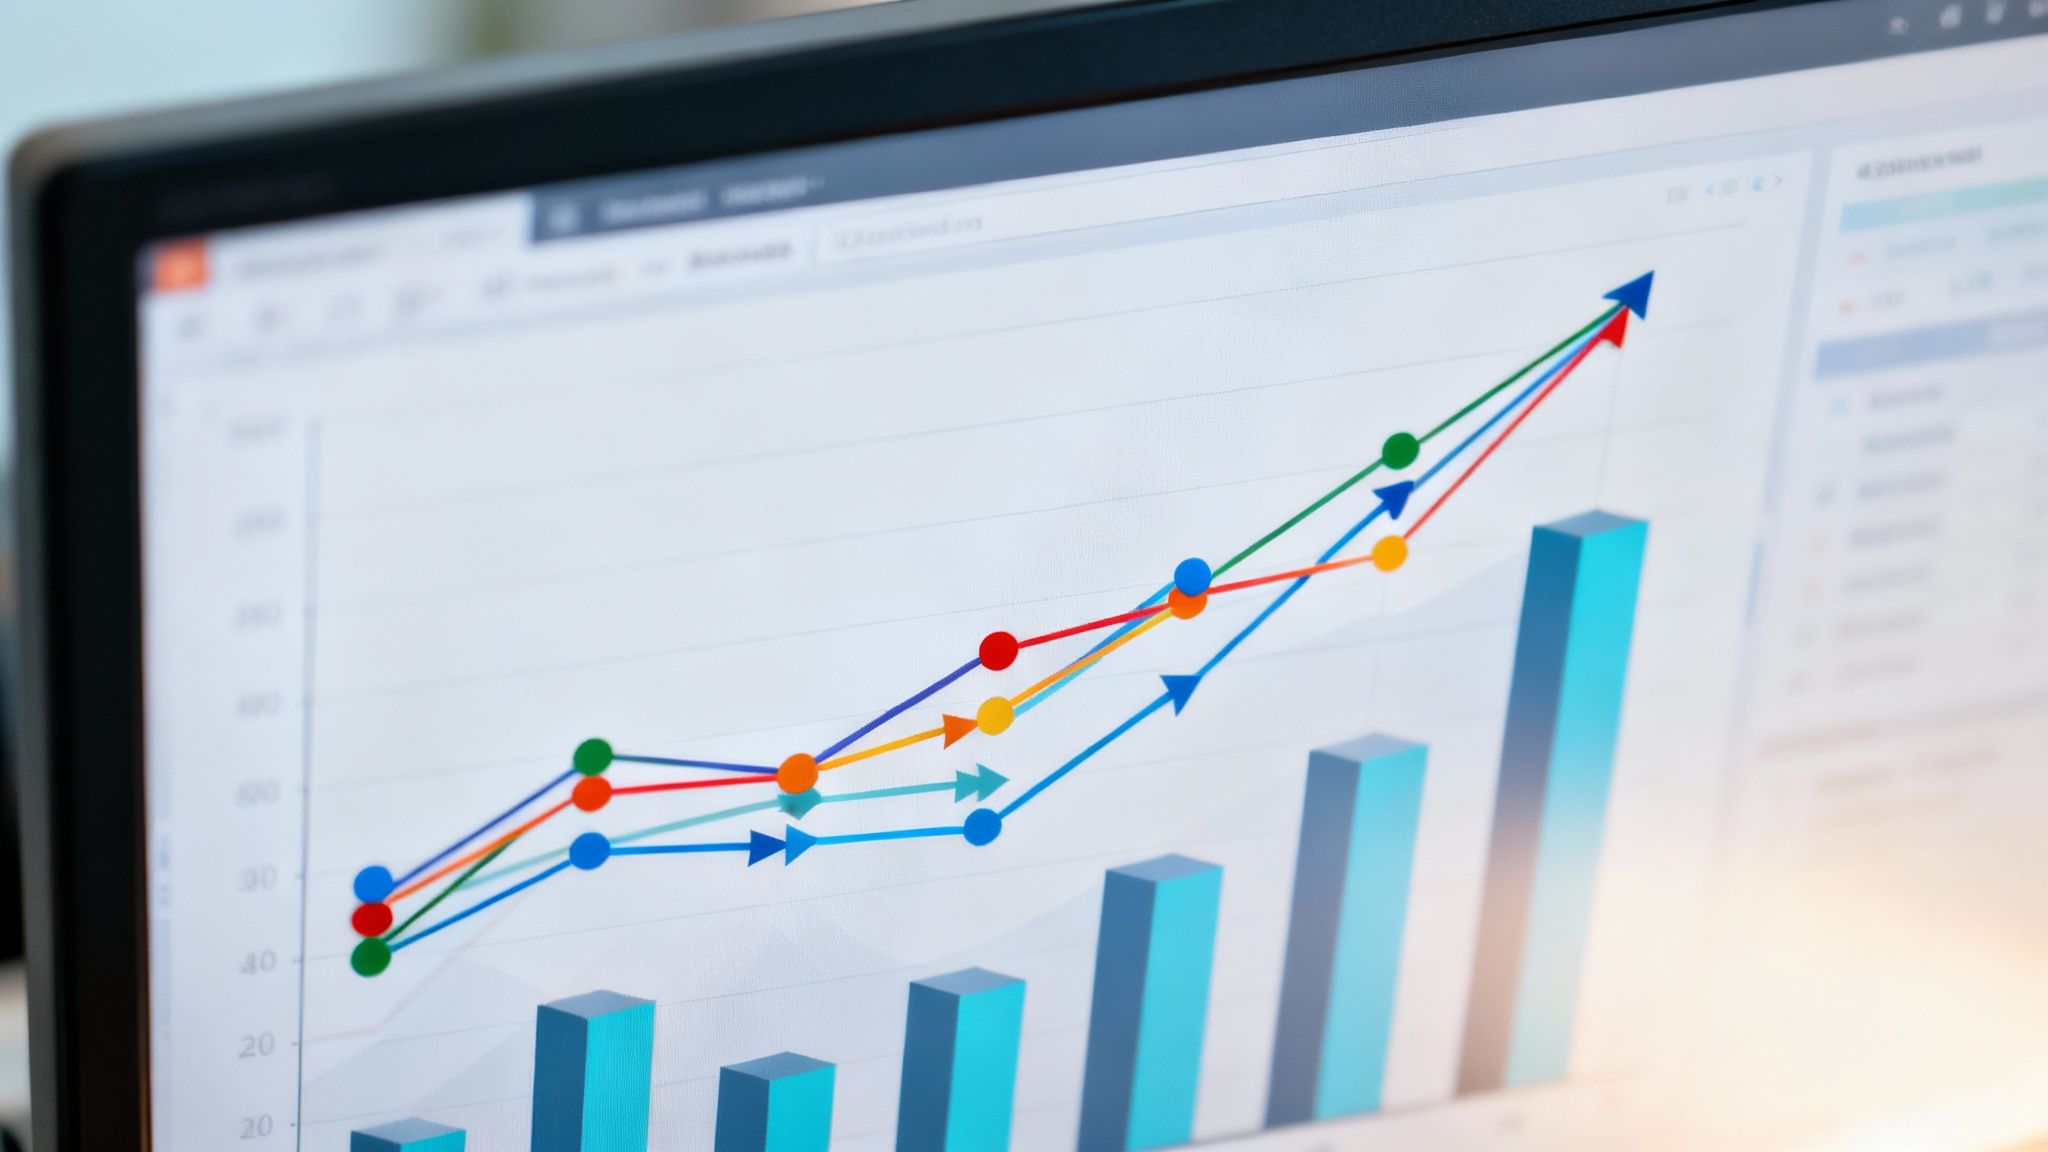
Just look at this Google Trends chart comparing search interest for "electric scooter" versus "electric bike."

It's pretty clear, right? "Electric bike" has consistently higher interest with predictable seasonal peaks. This signals a more stable, established market demand compared to the more up-and-down interest in scooters.
Advanced and AI-Driven Platforms
When you need to go deeper, it’s time to bring in the specialized platforms. These tools can give you much more granular data and even predictive insights, often using AI to connect dots you'd never spot on your own. According to the 2024 State of Marketing AI Report, adoption is blowing up, with tons of pros saying they "couldn’t live without AI."
A person who knows how to use AI will take the job of someone who doesn't. It's crucial for marketers to understand how to apply these tools for everything from research to execution.
Platforms like Semrush or Ahrefs are brilliant for digging into search query data, showing you the exact questions your audience is typing into Google. For bigger-picture industry reports, something like Statista gives you comprehensive data to back up your hunches.
And for those in niche spaces like decentralized finance, an AI-powered DeFi portfolio tracker is a game-changer. It automates the insane complexity of tracking asset performance and sniffing out yield opportunities in real-time. Mixing these tools together creates a powerful system for spotting trends early and making decisions based on data, not just gut feelings.
Interpreting Signals and Identifying True Trends
Let's be honest: data on its own is just noise. The real skill—the part that actually makes you money—is learning how to interpret that noise and pull out the real signals from all the fleeting distractions. This is where so many people get stuck, drowning in spreadsheets but starved for actual insight.
A true trend isn't just a temporary blip on the radar; it’s a fundamental shift in behavior. Think about it this way: a sudden explosion in searches for a meme coin is probably just a fad. But a steady, year-over-year increase in demand for decentralized finance (DeFi) protocols? That points to a deeper cultural and technological shift.
Your job is to be a detective, connecting the dots between different data sources. You're looking for recurring themes that pop up in your sales figures, on-chain data, and social media chatter. When you see the same story from multiple angles, you know you're onto something real.
Separating the Signal from the Noise
The first big challenge is filtering out the anomalies that can throw you off course. A huge spike in trading volume for a particular token doesn't automatically mean it's the next big thing. It could just be a one-off mention from a big influencer or a reaction to a specific news event. What you're really looking for is consistency and growth over time.
When you spot what looks like a pattern, it's time to ask some tough questions:
Is it sustainable? Are there real drivers behind this, like a change in technology or user demographics, that suggest it has staying power?
Is it broad-based? Is the interest coming from a wide range of people, or is it just a tiny, insular group?
Is it consistent? Is the activity showing up across multiple platforms and data sets, or is it isolated to just one channel?
This same discipline applies when you're looking at charts. If you want to get better at spotting patterns in price action, you might find our guide on how to read crypto charts helpful—it breaks down the core concepts in a pretty straightforward way.
Identifying Correlations and Causal Links
Once you've zeroed in on a potential trend, the next step is to figure out why it's happening. Spotting a correlation—when two things happen at the same time—is the easy part. Proving causation—that one thing causes the other—is much harder, but infinitely more valuable.
For example, you might notice that sales of your product jump whenever a certain influencer posts about a related topic. That's a correlation. To test for causation, you could run a targeted ad campaign aimed directly at that influencer's followers and measure the direct impact on sales. Did they convert? That gets you closer to a causal link.
Key Takeaway: Real, powerful trends are almost never isolated events. They're tangled up with bigger shifts in technology, culture, and the economy. The goal is to understand those connections so you can see where the market is going before everyone else does.
This is especially true in consumer behavior. For instance, there's a growing global preference for local brands, with 47% of consumers saying that locally owned companies are a key factor in their buying decisions. This trend is huge in North America and is even starting to pressure major international brands to adapt. You can dig into more of these insights over at McKinsey.com.
This "buy local" movement isn't random. It’s tied to a much bigger consumer desire for authenticity and community connection. By getting a handle on these underlying drivers, you can stop just reacting to trends and start proactively positioning your business to ride the next big wave.
Turning Your Insights into Business Strategy
Let's be honest, analysis without action is just an intellectual hobby. All the data gathering and signal interpretation is pointless if it doesn't lead to tangible business decisions that actually drive growth. This is the moment where your hard work pays off and gives you a real competitive advantage.
So many businesses produce beautiful reports filled with fascinating data, only to let them gather dust on a digital shelf. The real trick is building a clear bridge between an insight and a strategic move. Your findings should directly inform everything from your product roadmap to marketing campaigns and even operational tweaks.
From Insight to Implementation
Let's walk through a real-world scenario. Imagine a local coffee shop starts noticing a pattern in their customer feedback and social media mentions. Keywords like "oat milk," "vegan," and "plant-based" are popping up 30% more frequently than they did six months ago. At the same time, their sales data shows a small but steady dip in traditional dairy-based lattes.
This isn't just a blip; it's a clear signal that consumer tastes are shifting. The insight is simple: demand for dairy alternatives is on the rise. Now, how does that simple observation become a concrete strategy?
Product Development: Instead of just offering oat milk as a substitute, they could introduce a whole new line of premium, oat-milk-based signature drinks.
Marketing: They could launch a targeted social media campaign, maybe calling it "Plant-Powered Mornings," complete with vibrant photos and customer testimonials.
Operations: They'd need to make sure their suppliers can handle the increased demand for oat milk and train baristas on how to prepare the new drinks for the best possible taste and texture.
This process transforms a simple data point—"more people are asking for oat milk"—into a multi-faceted business strategy that attracts new customers, keeps existing ones happy, and boosts the bottom line.
This same logic applies to bigger, more complex market shifts. Take sustainability, for example. It's a massive driver of consumer behavior right now. By 2025, companies are widely expected to integrate Environmental, Social, and Governance (ESG) practices into their core operations. We're seeing this everywhere, from the transition to renewable energy to circular economy models in retail.
Brands like Patagonia are absolutely crushing it by offering repair services and buy-back programs. This not only reduces waste but also opens up entirely new revenue streams. If you want to dive deeper into these kinds of shifts, you can discover more insights about emerging 2025 business trends on Quantive.com.
Building a Feedback Loop
Once you've made a change based on your analysis, your work isn't done. Not even close. The market is always moving, so you need a system to monitor the impact of your decisions. This creates a continuous feedback loop that keeps your business agile and ready for what's next.
First, set up some key performance indicators (KPIs) to track the success of your new initiatives. For our coffee shop, they'd be watching a few things closely:
Sales Velocity: Are the new plant-based drinks selling faster than the old dairy options?
Customer Feedback: Are the social media mentions more positive now? Do new surveys show people are happy with the expanded menu?
Profit Margins: After accounting for the new ingredients and pricing, how profitable is each drink they sell?
This feedback loop does more than just tell you if you were right. It provides fresh data for your next round of analysis, making sure you're not just reacting to a single trend but building a system for constant adaptation.
Of course, evaluating the financial impact is critical. Understanding how to calculate investment returns from these strategic pivots will tell you what's really working. When you connect your trend analysis directly to measurable outcomes, you create a powerful engine for sustained growth.
Burning Questions About Market Trend Analysis
Even with the slickest tools and a mountain of data, you're bound to have questions when you first start digging into market trends. It’s totally normal. Getting a handle on these common sticking points is what separates a good analysis from a great one.
Think of this less as a one-time exam and more as building a muscle. It's about staying curious and knowing what to ask. Let's jump into a few of the big questions that always come up.
How Often Should I Be Doing This?
Honestly, it all comes down to how fast your industry spins. If you're in a fast-paced world like tech or fashion, a proper deep dive every quarter is a solid game plan. You'll want to back that up with some lighter monthly check-ins to stay on your toes.
For more stable industries, you might get away with a big review just twice a year. But here’s the real pro-tip: set up a system for continuous monitoring. This doesn't have to be a huge time-sink. It could be as simple as a weekly glance at social media chatter or competitor news. This way, you catch the important whispers before they turn into disruptive roars.
Key Insight: Don't treat trend analysis like a chore you do once and forget. It's an ongoing conversation with your market. The aim is to always have a feel for what’s happening, even if the heavy lifting only happens a few times a year.
What's the Difference Between a Fad and a Trend?
Ah, the million-dollar question. Getting this right can save you from pouring money and time down the drain.
A fad is a flash in the pan. It’s an intense, short-lived craze that explodes onto the scene and vanishes just as quickly. Think of it as market lightning—exciting, but it doesn't stick around.
A trend, on the other hand, has legs. It’s a more fundamental shift in how people behave, how the market works, or the technology we use. Trends build over time and have a lasting impact. A huge part of your job is learning to spot the difference so you don't bet the farm on something that will be forgotten by next season.
Can a Small Business Really Do This?
You bet. You don't need a Wall Street budget or a team of PhDs to pull this off. The great thing about the tools available today is that they've made powerful insights accessible to everyone.
Plenty of free and low-cost options are out there for a small business to get started:
Google Trends is your best friend for seeing what people are searching for in your niche.
Social media platforms have built-in analytics that are surprisingly powerful for monitoring conversations.
Simple customer surveys using tools like Google Forms can give you direct feedback.
Your own sales data is a goldmine for spotting what your customers are actually doing.
The secret isn't about outspending your competition; it’s about being smart, consistent, and focusing on the data that truly matters to your business and your customers.
Ready to stop guessing and start earning? Yield Seeker uses AI to automatically find and manage the best stablecoin yield opportunities for you. Get started in seconds and let our platform do the heavy lifting.