

Back to Blog
What Is Maximum Drawdown a Complete Guide for Investors
Discover what is maximum drawdown and why it's a vital risk metric. Learn how to calculate MDD and use it to build a resilient DeFi investment strategy.
Oct 19, 2025
generated
When you hear people talk about investment risk, they're often throwing around vague terms. But what if there was a number that could show you, in stark terms, the absolute worst-case scenario you could have faced with an investment?
That's exactly what Maximum Drawdown (MDD) does.
So, What Is Maximum Drawdown, Really?
Forget the complicated financial jargon for a second. Maximum Drawdown is simply the biggest drop your investment has ever taken from its highest peak to its lowest point before it started to climb back up.
Think of it like this: your portfolio's value is on a mountain climbing expedition. It hits a new high—a glorious peak! But then, the path turns downward into a deep valley, or a trough, before it starts ascending again. The MDD measures that single, gut-wrenching drop from the peak to the bottom of the valley.
It answers one powerful, and slightly terrifying, question: "What's the most I could have possibly lost if I had the worst timing ever—buying at the absolute top and panic-selling at the rock bottom?"
Why You Can't Ignore This Metric
Knowing how much you can make is exciting, but knowing how much you could lose is what keeps you in the game. MDD gives you a clear, unfiltered look at the downside risk you’re signing up for. It’s not about the everyday ups and downs; it zeroes in on the most painful loss an investment has dished out.
This is especially crucial in the wild west of DeFi and yield farming. A protocol might be flashing a massive APY, but that shiny number means very little if it comes with an equally massive MDD. A 90% drawdown can wipe you out long before you ever see those promised returns.
Knowing the MDD for a strategy helps you:
Honestly assess your risk tolerance: Could you stomach watching your portfolio value get cut in half—a 50% drop—without hitting the sell button in a panic? MDD tells you if that's a real possibility.
Compare strategies like a pro: A strategy with a lower, steadier return but a much smaller MDD is often a far better choice for long-term survival than a high-risk, high-reward gamble.
Set realistic expectations: Every investment, no matter how good, will have downturns. MDD prepares you mentally for how bad it can get, so you're not caught off guard.
Understanding risk is a journey, and MDD is just one stop. If you're ready to go deeper, you can delve into more financial risk metrics to build a more complete picture. But by truly grasping what maximum drawdown is telling you, you're already way ahead of the curve and better prepared to navigate the markets with confidence.
How to Calculate Your Own Maximum Drawdown
Alright, let's roll up our sleeves and figure this out for your own portfolio. Calculating your maximum drawdown is actually a lot simpler than it sounds. It all boils down to one straightforward formula that spits out a clear percentage of your biggest dip.
The formula looks like this: MDD = (Trough Value - Peak Value) / Peak Value
What we're doing here is finding the absolute highest point your investment hit (the Peak Value) and the lowest it dropped to from that high (the Trough Value) before it started to recover. The result shows that drop as a simple percentage of its peak.
A Practical DeFi Example
Let's walk through a scenario that’s probably familiar to anyone in DeFi yield farming. Imagine you jumped into a promising liquidity pool with $5,000.
The Rise: Things go well. The pool is performing, and after a couple of months, your position swells to a new high of $8,000. This is your Peak Value.
The Fall: Uh oh. A market-wide correction hits, and the tokens in your pool take a nosedive. Your investment's value sinks all the way down to $4,500. This is your Trough Value.
The Recovery: The dust settles, and your investment starts its slow climb back up.
Now, let's plug those numbers into our formula:
MDD = ($4,500 - $8,000) / $8,000
MDD = -$3,500 / $8,000
MDD = -0.4375, or -43.75%
The journey from your initial deposit to the peak and then the gut-wrenching drop looks something like this:
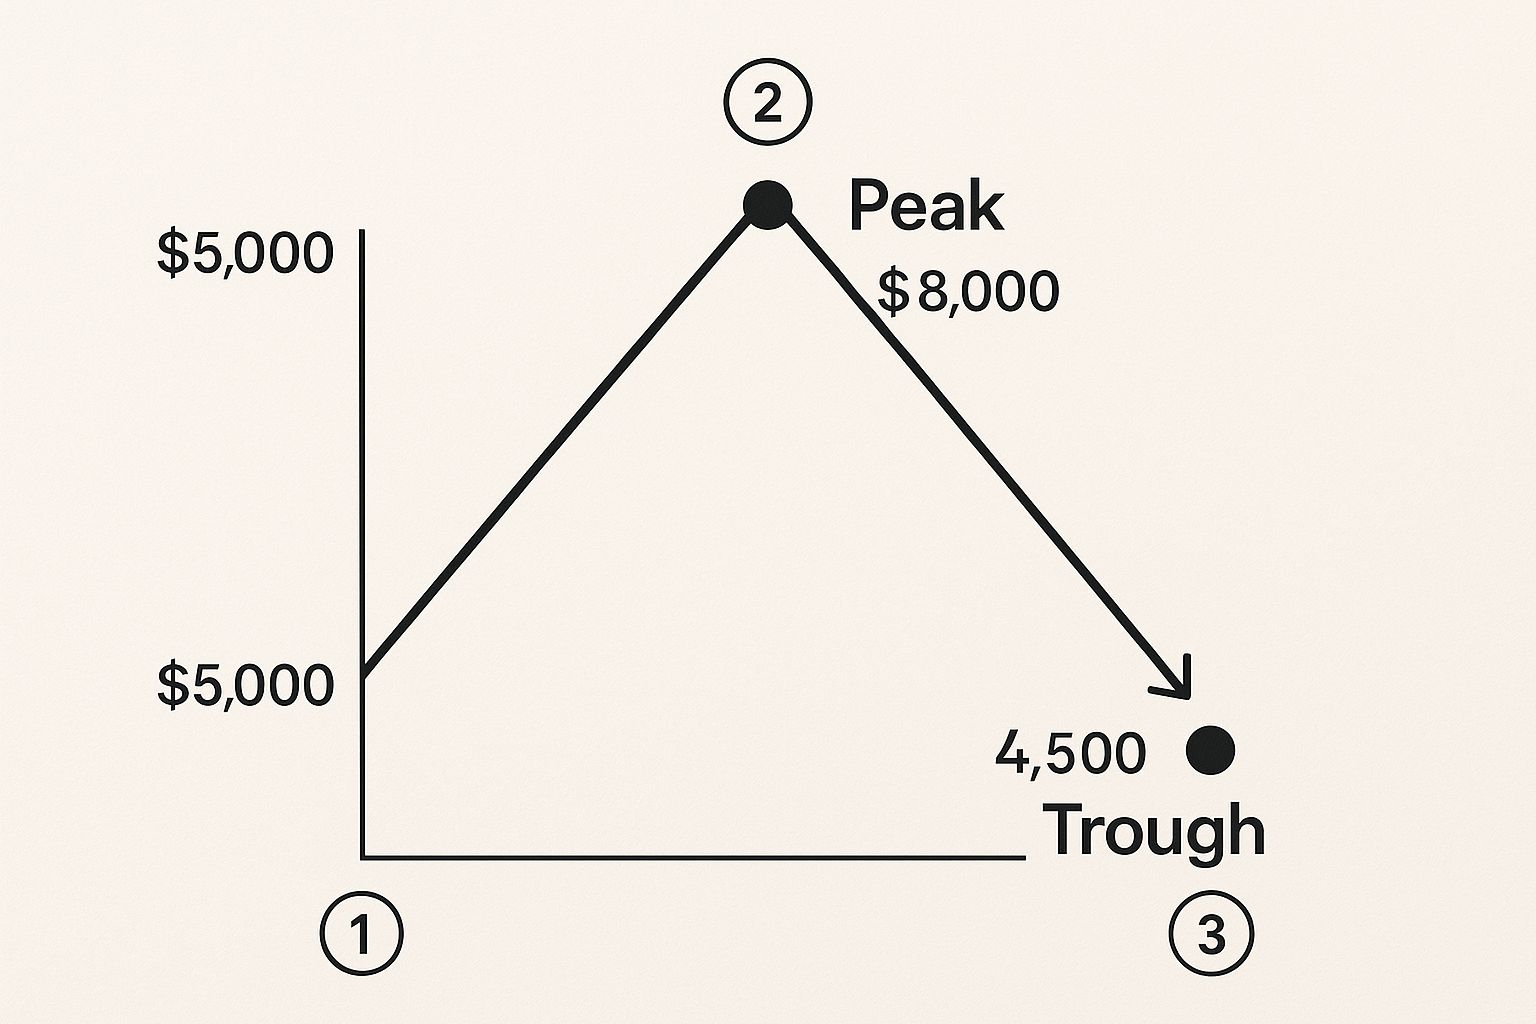
This simple chart clearly shows that painful slide from the highest high to the lowest low. A 43.75% maximum drawdown means that at its worst moment, your investment was down nearly half from its best day. That single number gives you a powerful, unfiltered look at the real risk of a strategy.
Of course, MDD is all about the downside. To get the full picture, you also need to know how to measure the upside. Check out our guide on how to calculate investment returns to complete your performance analysis.
Learning from Major Historical Market Drawdowns
To really wrap your head around what is maximum drawdown, you have to look back at history. Abstract percentages are one thing, but seeing how devastating market meltdowns played out in the real world makes the concept hit home. These moments are the ultimate stress test.
They show us the sheer psychological and financial pressure investors are put under during a severe crash. They’re a brutal reminder that markets don't always go up and that knowing the worst-case scenario is a vital part of any solid investment plan.
The Dot-Com Implosion
The turn of the millennium was a painful reality check for anyone piling into tech stocks. The NASDAQ Composite index, riding a wave of pure speculative hype for anything internet-related, went through a truly savage peak-to-trough collapse.
A maximum drawdown is more than just a statistic; it's a measure of potential financial and emotional pain. Historical examples show us the kind of resilience required to stay invested through the worst of times.
From its high in early 2000, the index cratered by a staggering 78% by late 2002. Think about that for a second. A $100,000 portfolio invested at the very peak would have shriveled to just $22,000 at the bottom. It then took more than a decade for the index just to get back to where it started.
The 2008 Global Financial Crisis
A more recent and widespread gut punch was the 2008 crisis. What started with bad mortgages spiraled into a full-blown panic that took down global markets with it.
During this chaos, the S&P 500 suffered a maximum drawdown of over 56% from its 2007 peak to its 2009 low. Investors had to sit and watch as more than half their portfolio's value simply evaporated before the market finally turned a corner. You can find more detail on how these historical drawdowns highlight risk across different types of assets.
These history lessons aren't meant to scare you off; they're meant to give you perspective. Whether you’re in traditional markets or deep in DeFi, knowing an asset’s historical drawdown prepares you for the wild ride ahead. It helps you make clear-headed decisions based on your actual risk tolerance, not just the temptation of high returns.
Why MDD Is a DeFi Investor’s Most Important Tool
In the wild world of DeFi and yield farming, those sky-high APYs are what grab all the headlines. They're exciting, no doubt. But they only tell you half the story.
Maximum drawdown (MDD) is the tool that tells you the other, more sobering, side of the tale. It’s what keeps your feet on the ground and, frankly, helps you survive in this game.

The crypto market is notoriously volatile, which makes MDD an even more vital metric here than in traditional finance. A 20% drawdown on the S&P 500 is considered a full-blown bear market. In crypto? Drops of 50% or more on a single asset are just another Tuesday. MDD is how you figure out if you truly have the stomach for these kinds of swings.
The Unique Risks of DeFi
Unlike traditional markets, DeFi has its own special flavors of risk that can trigger catastrophic drawdowns in the blink of an eye. If you only focus on the yield number without understanding these pitfalls, you're setting yourself up for disaster. And these risks go way beyond simple price charts.
Here are a few of the big ones specific to DeFi:
Smart Contract Exploits: A tiny bug in a protocol's code is all a hacker needs. This can lead to a complete drain of funds and a gut-wrenching 100% drawdown overnight.
Impermanent Loss: This is a tricky one for liquidity providers. If the prices of the two tokens in your pair move too far apart, the value of your position can plummet compared to if you'd just held the assets separately.
Sudden Token Crashes: The farm's reward token—the very thing you're farming for—can suddenly collapse. Bad tokenomics or a shift in market sentiment can erase your hard-earned yield and crater your total position.
Maximum drawdown cuts through the noise of promised returns to reveal the true cost of chasing yield. It forces you to ask, "Is the potential reward worth the historical pain this strategy has inflicted?"
Picture two liquidity pools. Pool A is dangling a juicy 80% APY in your face, but it has a history of a -75% MDD. Pool B, on the other hand, offers a more modest 15% APY but has an MDD of just -20%.
The rookie yield-chaser dives headfirst into Pool A, only to get completely wiped out when the market turns.
The savvy investor, however, uses MDD to see the bigger picture. They recognize that Pool B offers a much more sustainable, and less stressful, path to building wealth. Creating a solid portfolio means looking past the hype and using MDD to understand the real price of those returns.
To really build that resilience, check out our full guide to DeFi risk management strategies. This is how you start making smarter, more durable investment decisions.
Using Maximum Drawdown To Shape Your Portfolio
Alright, so knowing what maximum drawdown is and how to calculate it is a great start. But the real magic happens when you start using it to make smarter, tougher decisions with your money. This isn't just theory; it's a practical gut check for what you can actually handle.
Before you jump into a new DeFi protocol, dig up its historical MDD. If you see it’s had a -60% drop in the past, you have to ask yourself a tough question: "Could I have stomached that?" Staring that number in the face forces you to confront the real pain of a major downturn, steering you away from strategies that look great on paper but don't match your personal grit.
A Better Way to Compare Investments
Maximum drawdown really shines when you use it to compare different assets or yield-farming opportunities on a level playing field. It's the secret ingredient for figuring out risk-adjusted returns, letting you see which strategy is giving you the most bang for the buck—or in this case, the most return for the risk you're taking on.
One of the slickest ways to do this is with metrics that bake MDD right into the formula. Think of something like the Calmar ratio, which simply pits the average annual return against the maximum drawdown. For instance, if a fund pulls in a 12% average annual return but had a 20% maximum drawdown, its Calmar ratio is 0.6. This little number tells you exactly how much return you earned for every unit of gut-wrenching risk you endured.
By using simple ratios like this, you can compare two completely different DeFi protocols and make a much more informed call, balancing both the shiny potential gains and the painful potential losses.
Building a Portfolio That Can Take a Punch
At the end of the day, working MDD into your analysis helps you build a portfolio that's more durable. Instead of just chasing the highest APY, you start thinking like an engineer, building a system designed to survive the inevitable market storms. To really make this work, it needs to be part of broader, comprehensive risk management strategies in cryptocurrency trading.
A portfolio that lines up with your risk tolerance is a portfolio you can actually stick with. Maximum drawdown is the tool that makes sure you don't find out your limits the hard way—during a market crash.
This might mean you consciously choose a slightly lower APY in a protocol with a much smaller historical MDD. That’s a trade-off that, more often than not, leads to way better outcomes in the long run.
This mindset also works hand-in-glove with other risk management moves. For example, knowing an asset’s drawdown profile can tell you when and how to tweak your positions, which is a massive part of a solid cryptocurrency portfolio rebalancing strategy. The goal isn't just to hit your financial targets; it's to build a portfolio that lets you sleep at night.
Got Questions About Maximum Drawdown? We've Got Answers.
Even after you've got the basics down, a few practical questions always pop up when you start using a new metric. Let's tackle the most common ones and clear up any lingering confusion about maximum drawdown.
Is a High Maximum Drawdown Always a Bad Thing?
Not necessarily. While a high MDD definitely signals higher risk, it often walks hand-in-hand with strategies that have the potential for bigger rewards. The real question is whether it matches up with your personal risk tolerance.
An aggressive investor hunting for serious growth might be perfectly fine with a high MDD. On the other hand, someone more conservative will want to see a much lower historical MDD, prioritizing stability over everything else. It’s all about finding a strategy whose volatility matches your own stomach for risk.
MDD isn't a judgment; it's a mirror. It just reflects an investment's historical turbulence, letting you decide if you're truly up for that kind of ride.
How Is Maximum Drawdown Different from Volatility?
While they both measure risk, they tell you very different stories. Volatility, usually measured by standard deviation, looks at all the price swings—both up and down—around an average. Think of it as a broad snapshot of an asset's general jumpiness.
Maximum drawdown is way more specific. It laser-focuses on the worst-case scenario, measuring the single largest drop from a peak to a trough. In short, MDD gives you a much clearer picture of the kind of pain you might have to sit through during a really bad run.
Can I Use MDD to Predict the Next Big Crash?
Absolutely not. Think of MDD as a historical, backward-looking metric. It shows you how an asset held up under pressure in the past.
It's an incredibly valuable tool for understanding an investment's risk profile and setting realistic expectations, but it is not a crystal ball. Something completely unexpected could always trigger drawdowns larger than anything we've ever seen before. Use it as a guide, not a guarantee.
Ready to put your stablecoins to work without the guesswork? Yield Seeker uses an AI Agent to automatically find and manage the best yield opportunities in DeFi for you. Start earning smarter, not harder. Get started with Yield Seeker today.