

Back to Blog
What Is Time Weighted Return An Investor Guide
What is time weighted return? Understand this key metric with clear examples. Learn how TWR measures true investment performance, free from cash flow effects.
Oct 28, 2025
generated
When you're trying to figure out how well your investments are really doing, things can get messy fast. Did that big deposit you made right before a market surge make your strategy look better than it actually is? What about that withdrawal you made just before a dip? This is where Time-Weighted Return (TWR) comes in.
Think of TWR as the purest way to measure an investment's performance. It completely strips out the distorting effects of your own cash movements—deposits and withdrawals. It’s all about judging the skill of a fund manager or the raw effectiveness of a strategy, completely independent of when you or anyone else decided to add or pull out money.
The True Measure of an Investment Strategy

Let’s imagine you and a friend both put money into the same DeFi protocol. You drop in a big lump sum right before its token price skyrockets. Your friend, a bit more cautious, invests a smaller amount and only adds more after a major correction.
At the end of the year, who had the better personal outcome? You probably did, thanks to some killer timing. But here’s the key question: did the protocol itself perform better for you than for your friend? Absolutely not. Its underlying growth was exactly the same for both of you, regardless of when you got in. This is precisely the question that TWR is built to answer.
Isolating Performance from Investor Behavior
TWR gives you a clean, clear picture of how well a manager or a strategy is actually growing a portfolio. It does this by breaking down the total investment period into smaller chunks, with each deposit or withdrawal marking the end of one period and the start of a new one.
This method effectively tunes out the "noise" from your personal timing decisions, which is why it's the gold standard for comparing different fund managers or stacking your portfolio's performance against a market index. To learn more about how the pros use it, check out this deep dive on isolating performance with TWR.
By removing the influence of individual investor actions, TWR helps you properly evaluate:
Manager Skill: How good was the person or algorithm actually at picking winners?
Strategy Effectiveness: Is the investment strategy itself generating real growth, or was I just lucky with my timing?
True Benchmarking: How does my portfolio's performance stack up against something like the S&P 500 on a true apples-to-apples basis?
Quick Overview Time Weighted Return vs Other Metrics
Before we jump into the math, it’s super helpful to see how TWR stands apart from other common ways of measuring returns.
Metric | Primary Purpose | Influence of Cash Flows |
|---|---|---|
Time-Weighted Return | To measure the performance of the investment strategy. | None. It is isolated. |
Money-Weighted Return | To measure the investor's personal return. | High. Timing matters. |
Simple Return | To measure basic growth over a single, static period. | Not applicable. |
This little table really highlights the core difference: TWR is about the strategy, while other metrics are more about your personal journey as an investor. Both are useful, but they answer very different questions.
How to Calculate Time-Weighted Return
Calculating a time-weighted return (TWR) sounds a lot more intimidating than it actually is. You don't need a PhD in finance; the whole idea is just to break up your investment's history into smaller, simpler pieces.
Think of it like judging a movie. You wouldn't just look at the first and last scenes. Instead, you'd watch it scene by scene, and TWR works the same way. Every time you add or remove money, a new "scene" begins.
At its core, a time-weighted rate of return breaks up the portfolio performance across the measurement period into smaller ‘sub-periods’ whenever there is an inflow or outflow for the portfolio.
This lets you stitch together the performance of each individual scene to get a clear picture of how your strategy is really doing, no matter when you decided to put more money in or take some out.
Step 1: Pinpoint Your Cash Flow Events
First things first, you need to identify every single deposit and withdrawal. These are the moments that slice your investment timeline into distinct sub-periods.
Let's walk through an example. Say you start the year with a $10,000 portfolio. Here’s what happens:
January 1: Starting Value = $10,000
April 1: You deposit $2,000.
September 1: You withdraw $1,000.
December 31: End of the year.
Those two transactions—the deposit and the withdrawal—split your year into three separate periods:
Period 1: January 1 to March 31
Period 2: April 1 to August 31
Period 3: September 1 to December 31
Each of these is now a self-contained window where no outside cash messed with your performance.
Step 2: Calculate the Return for Each Sub-Period
Now, you just need to calculate the simple return for each of these periods. The formula is a breeze: Ending Value / Beginning Value.
Let's add some performance numbers to our example:
Period 1 (Jan 1 - Mar 31):
Beginning Value: $10,000
Ending Value (just before your deposit): $11,000
Return (HPR1) = $11,000 / $10,000 = 1.10
Period 2 (Apr 1 - Aug 31):
Beginning Value (right after your deposit): $11,000 + $2,000 = $13,000
Ending Value (just before your withdrawal): $13,500
Return (HPR2) = $13,500 / $13,000 = 1.0385
Period 3 (Sep 1 - Dec 31):
Beginning Value (right after your withdrawal): $13,500 - $1,000 = $12,500
Ending Value (at year-end): $14,000
Return (HPR3) = $14,000 / $12,500 = 1.12
You've now got the return for each "scene." By the way, if you want a deeper dive into the different ways to measure returns, our guide on how to calculate investment returns is a great place to start.
Step 3: Geometrically Link the Returns
This is the final step. You can't just add these returns together; that wouldn't account for compounding. Instead, you have to "geometrically link" them.
It sounds complex, but it just means you multiply them together. The formula looks like this:
TWR = [(1 + R1) x (1 + R2) x ... x (1 + Rn)] - 1
Here, R is the return for each sub-period (which is just HPR - 1). An even simpler way is to just multiply your Holding Period Returns (HPR) from Step 2 and then subtract one at the end.
Let's finish our example:
TWR = (HPR1 x HPR2 x HPR3) - 1
TWR = (1.10 x 1.0385 x 1.12) - 1
TWR = 1.2795 - 1
TWR = 0.2795 or 27.95%
There you have it. The time-weighted return for your portfolio over the whole year is 27.95%. This number shows purely how well your strategy performed, completely stripped of the noise from your decision to add or remove funds.
Time Weighted Return in Real World Scenarios
This is where the rubber meets the road. Abstract formulas are one thing, but seeing time-weighted return (TWR) in action is where it all starts to click. Let's walk through a couple of distinct, real-world examples to see how TWR cuts through the noise of cash flows to give you a clean performance number.
We’ll kick things off with a classic stock portfolio and then jump into the fast-paced world of DeFi. You'll see how TWR works its magic to give you an unbiased picture of your strategy's performance, no matter what you're investing in or when you move your money around.
Example 1: The Traditional Stock Portfolio
Let's imagine an investor, Alex, who starts the year with a $50,000 stock portfolio. Alex is a pretty active investor, adding money when feeling confident and pulling some out for a planned expense. This creates a few cash flow events during the year.
Here’s a quick look at Alex’s portfolio journey:
January 1 (Start): The portfolio is worth $50,000.
April 1 (Deposit): The market's been good, and the portfolio has grown to $55,000. Alex decides to add another $10,000, bringing the new starting value for the next period to $65,000.
October 1 (Withdrawal): The market went a bit sideways, and the portfolio is now at $68,000. Alex needs $5,000 for a home renovation and pulls it out, leaving $63,000 to work with.
December 31 (End): The portfolio finishes the year strong, closing at $72,450.
To get the TWR, we have to isolate the return for each "sub-period" created by those cash flows.
Period 1 (Jan 1 - Mar 31): $55,000 / $50,000 = 1.10
Period 2 (Apr 1 - Sep 30): $68,000 / $65,000 = 1.046
Period 3 (Oct 1 - Dec 31): $72,450 / $63,000 = 1.15
Now for the magic part. We geometrically link these returns together: (1.10 x 1.046 x 1.15) - 1 = 1.3213 - 1 = 0.3213
So, Alex's time-weighted return for the year is 32.13%. This number tells us exactly how the stocks performed, completely ignoring the fact that Alex happened to add money right before a flat period and took money out just before a strong one. It's the pure, unadulterated performance of the investment choices.
This visualization breaks down the core process into three simple steps.
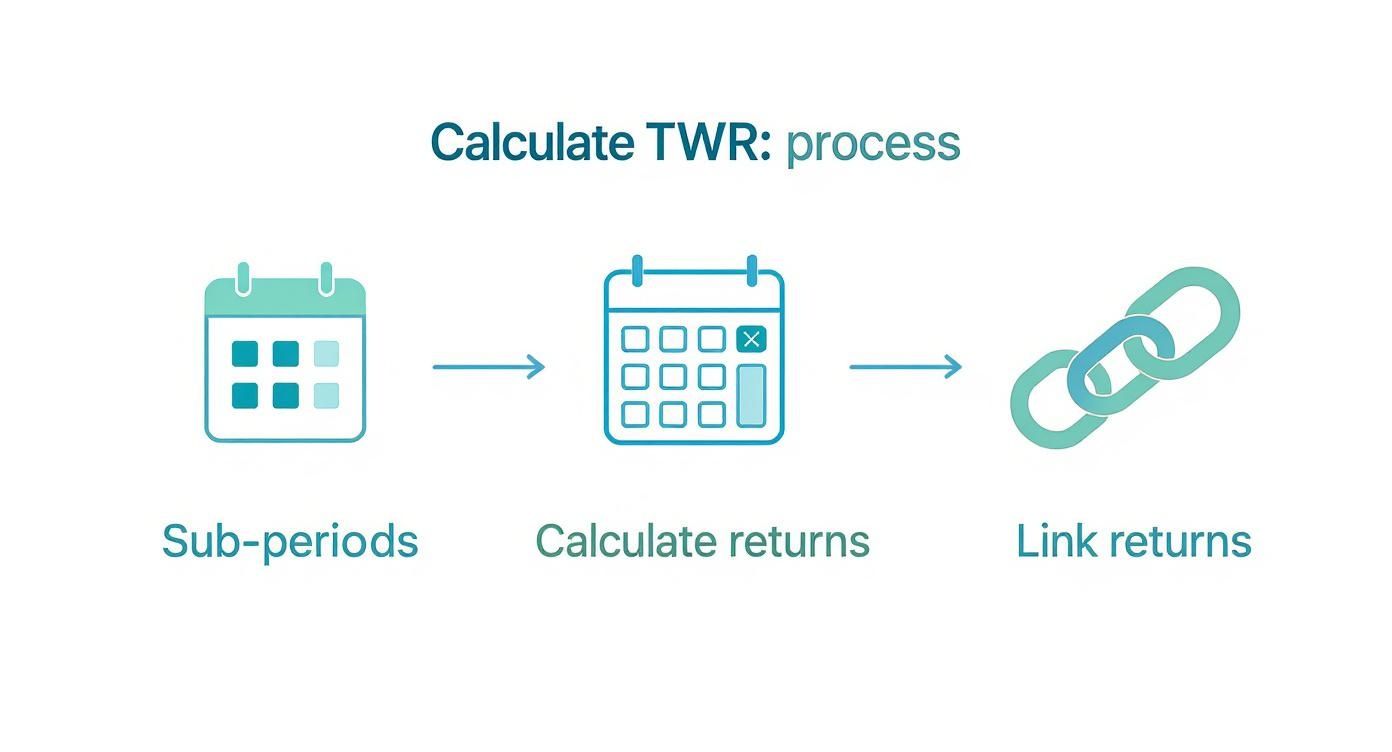
As you can see, the whole idea is to chop the timeline into smaller pieces around each cash flow event, calculate the performance of each piece, and then chain them all together.
Example 2: The DeFi Yield Farming Scenario
Alright, let's pivot to something a bit more modern: yield farming with stablecoins in DeFi. In this world, rewards are frequent and investors often add more capital, making TWR an absolute must-have for figuring out what's actually working.
Meet Ben, who's using a platform like Yield Seeker. He starts his journey with $5,000 in USDC on July 1.
July 1 (Start): Ben deposits $5,000.
August 1 (Rewards Claim): The position has grown to $5,050. Ben claims his $50 in rewards (which are automatically reinvested) and decides to add another $1,000. The new starting value is now $5,050 + $1,000 = $6,050.
September 1 (End of Quarter): His total is now up to $6,175.
Each time Ben claims rewards or adds new funds, it's a cash flow event that slices the timeline into a new sub-period.
In DeFi, every single airdrop, staking reward, or fee you collect is a cash flow. Trying to track all of this manually for a TWR calculation is a nightmare, which is exactly why automated portfolio trackers are so incredibly useful.
Let's calculate the returns for Ben's two sub-periods.
Period 1 (July 1 - July 31): $5,050 / $5,000 = 1.01
Period 2 (Aug 1 - Aug 31): $6,175 / $6,050 = 1.0206
Now, we link them to get the TWR for the two-month timeframe: (1.01 x 1.0206) - 1 = 1.0308 - 1 = 0.0308
Ben's time-weighted return is 3.08% for the two months. This number tells him exactly how the yield protocol itself performed, stripping out the impact of his decision to add more capital. It isolates the strategy's effectiveness—a vital metric for any serious DeFi user.
When you're dealing with digital assets, it's also worth remembering that the wider economic environment plays a role. For instance, understanding the global currency exchange market is crucial, as shifts there can influence stablecoin stability and overall market sentiment, which are key factors in these real-world scenarios.
TWR vs MWR: A Critical Comparison for Investors

To become a smarter investor, one of the most important hurdles to clear is understanding the difference between Time-Weighted Return (TWR) and Money-Weighted Return (MWR). Getting this right clears up a ton of confusion and gives you a much fuller picture of how your portfolio is really doing.
Here's the easiest way to think about it: TWR is your fund manager’s report card. It measures their skill and strategy, completely isolated from your own actions. MWR, on the other hand, is your personal bank statement—it shows your actual, real-world outcome, which is massively influenced by your decisions.
The Impact of Investor Timing
The core difference between these two metrics boils down to a single factor: control.
A fund manager controls which assets to buy or sell, but they have zero control over when you or anyone else decides to deposit or withdraw money. TWR was invented specifically to solve this problem, creating a fair way to judge a manager's performance on a level playing field.
On the other hand, MWR (also known as the Internal Rate of Return, or IRR) puts your decisions front and center. It gives more weight to periods when you have more money invested, meaning your timing has a huge impact on the final number.
TWR answers the question, "How well did the strategy perform?"
MWR answers the question, "How well did I do as an investor, including my timing?"
This distinction is crucial. Your MWR can be wildly different from your TWR, especially if you make large deposits or withdrawals during volatile periods. You really need both to understand what’s driving your results.
TWR vs MWR: A Tale of Two Investors
To see this in action, let’s imagine two investors, Clara and David. They both put money into the exact same fund, run by the same manager, over the same year. The only difference is when they invested.
The fund itself had a fantastic first six months, gaining 20%. But then it hit a rough patch, losing 10% in the second half of the year.
Here’s how their investments played out:
Clara (Invested Early): She put $10,000 in on January 1st and didn’t touch it all year.
David (Invested Late): He also invested $10,000, but he waited until July 1st, right after the big surge.
Let's see how their numbers shake out.
This simple scenario paints a crystal-clear picture of why both metrics matter.
Metric | Investor A (Clara) | Investor B (David) | Explanation |
|---|---|---|---|
Time-Weighted Return | 8% | 8% | Both investors had the same TWR because they were in the same fund. The manager’s performance (up 20%, then down 10%) was identical for both, resulting in an 8% TWR for the year. |
Money-Weighted Return | 8% | -10% | Clara’s MWR matches the TWR because she made no deposits or withdrawals. David, however, invested his entire stack just before the downturn, giving him a painful negative return. |
The fund manager delivered an identical 8% TWR for both investors, which accurately reflects their performance. Yet, David's personal experience was a -10% loss, a story told perfectly by his MWR. His timing was poor, and it cost him, even though the underlying strategy was the same one that made Clara money.
This is exactly why TWR became the gold standard in institutional finance. It isolates the portfolio manager's decisions from investor-driven cash flows, allowing for fair, apples-to-apples comparisons. As global markets expanded in the late 20th century, TWR became essential for benchmarking managers effectively. If you want to go deeper, you can discover more insights on how TWR is used for professional benchmarking.
Why You Can't Afford to Ignore TWR
Knowing how to crunch the numbers for Time-Weighted Return is a great first step. But understanding why it's so critical is what really separates novice investors from the pros. TWR isn't just another metric for your dashboard; it's a powerful tool for making sharper, more grounded decisions with your money.
Think of it as creating a level playing field. TWR strips away the impact of your own deposits and withdrawals—the cash flow noise—to show you one thing and one thing only: the pure performance of the asset or strategy itself. It removes the "luck" of good or bad timing. This means you can finally compare a fund you've been dollar-cost averaging into for years with one you just started last month, and know you're making a true apples-to-apples comparison.
A Clean Signal for Better Decisions
One of the biggest headaches in portfolio analysis is trying to separate a good strategy from just plain good timing. A huge deposit right before a bull run can make any strategy look brilliant, just as a withdrawal before a rally can make a solid strategy look like a dud. TWR cuts right through that mess.
It gives you a clean signal of an investment's underlying performance, and that's invaluable for a few reasons:
Fair Manager Comparison: You can objectively judge if one fund manager is actually outperforming another, no matter when you decided to give them your cash.
Strategy Validation: It helps you figure out if your chosen strategy—whether it's in traditional stocks or crazy DeFi protocols—is actually any good on its own merits.
Accurate Benchmarking: You can finally compare your portfolio's TWR against a benchmark like the S&P 500 and see if your active choices are truly adding value or just getting lucky.
Ultimately, digging into your TWR is all about making smarter moves, which is the core principle behind evidence-based decision making.
TWR in Dynamic Asset Allocation
This metric becomes absolutely essential when you're actively managing your portfolio and adjusting your risk. In the world of portfolio optimization, TWR has proven to be a game-changer for adapting to volatile markets.
For example, professional funds use time-weighted historical returns to rebalance their portfolios more effectively. It helps them capture recent market trends and get a more stable read on performance over time. This approach helps soften the blows from changing market conditions. For a more academic deep-dive, you can read the full research about these portfolio findings.
This is precisely why you need a crystal-clear understanding of your portfolio's TWR. It helps you see which parts of your strategy are pulling their weight and which are lagging, letting you adjust your holdings with real confidence. Once you have this clarity, you can explore different investment diversification strategies to put those insights into action.
TWR transforms your analysis from "How did my account do?" to "How well is my strategy performing?" This shift is fundamental to moving from a passive observer to an active, informed investor who can make strategic adjustments based on pure performance data, not just account balances.
Practical Tools for Calculating TWR
Understanding the theory is one thing, but actually applying it to your own portfolio is where you really start to see the benefits. Let’s be honest, calculating TWR by hand, especially if you’re actively moving funds around, is a recipe for headaches and errors.
Fortunately, you don’t need to break out the pen and paper. Modern tools make this powerful metric accessible to everyone, letting you focus on making sense of the numbers instead of just crunching them.
Building a TWR Calculator in Excel or Google Sheets
For many people, the good old spreadsheet is the perfect place to start. Building your own calculator in Excel or Google Sheets gives you complete control and a transparent view of your performance data.
It's simpler than it sounds. Here’s a quick guide to get you set up:
Set Up Your Columns: First, create columns for
Date,Portfolio Value Before Cash Flow,Cash Flow (Deposit/Withdrawal), andPortfolio Value After Cash Flow.Log Your Data: Start with your initial deposit. Every time you add or remove funds, you'll record the portfolio's value right before you make the transaction, the amount of the cash flow itself (positive for deposits, negative for withdrawals), and the new total value after the transaction settles.
Calculate Sub-Period Returns: In a new column, you'll figure out the Holding Period Return (HPR) for each individual period. The formula is:
Value Before Cash Flow / Previous Period's Value After Cash Flow.Link the Returns: In a final cell, use the
PRODUCTfunction to multiply all your HPRs together. Subtract 1 from that result, and you've got your final TWR.
This method works beautifully for traditional portfolios or DeFi strategies that aren't too active. But if you're dealing with dozens of transactions, you'll quickly see why a more automated solution is a lifesaver. This is exactly why a dedicated DeFi portfolio tracker is so valuable—it handles all these complex calculations for you in the background.
Automating TWR with a Simple Python Script
If you're comfortable with a bit of code, a simple Python script can automate the whole process. This is especially handy when you're working with large datasets exported from exchanges or protocols, as it saves a ton of time and eliminates the risk of manual typos.
Here’s a basic Python snippet that shows the logic. It just takes a list of your sub-period returns and spits out the final TWR.
def calculate_twr(sub_period_returns):
"""
Calculates the Time-Weighted Return from a list of sub-period returns.
Each return should be in decimal format (e.g., 10% is 0.10).
"""
Add 1 to each return before multiplying
linked_returns = 1
for r in sub_period_returns:
linked_returns *= (1 + r)
Subtract 1 to get the final TWR percentage
twr = linked_returns - 1 return twr
Example from our previous scenario
returns = [0.10, 0.0385, 0.12] final_twr = calculate_twr(returns)
print(f"The Time-Weighted Return is: {final_twr:.2%}")
Output: The Time-Weighted Return is: 27.95%
Common Questions About Time-Weighted Return
Digging into investment metrics can definitely bring up some tricky questions. Let's tackle the most common points of confusion about time-weighted return, giving you clear, straight answers so you can use this powerful tool with confidence.
When Should I Use Time-Weighted Return Instead of Simple Return?
The short answer: use time-weighted return any time you add money to or pull money out of your investment. A simple return calculation just isn't built for that. It only works if you put money in once and don't touch it.
TWR is what the pros use to compare fund managers or different strategies for a reason. It strips away the impact of your timing on deposits and withdrawals, giving you a clean, apples-to-apples look at the strategy's performance. Simple return just can't do that.
Can I Lose Money If My Portfolio Has a High TWR?
Yes, you absolutely can. This is a super important point to get your head around. A positive TWR means the strategy or the fund manager made good calls. But your personal outcome—what's actually in your wallet—is a whole different story because it depends on your timing.
Imagine you dump a big chunk of cash into a fund right before the market takes a nosedive. Your personal return, or Money-Weighted Return, could easily be negative. This can happen even if the fund's TWR for the year ends up being positive because the manager's strategy recovered brilliantly after your poorly timed deposit.
TWR shows how well the manager’s choices performed over time. It does not show how well your personal timing worked out.
Is TWR a Headache for Crypto and DeFi Investments?
The principle is the same, but yes, the calculation can get messy in DeFi. The main reason is the sheer frequency of cash flow events that are just part of the game in this space.
Think about it. Every one of these is a cash flow that creates a new sub-period for a proper TWR calculation:
Staking rewards you claim
Airdrops that land in your wallet
Liquidity pool fees you earn
New capital you add to a position
Trying to track all this by hand is a nightmare. This is exactly why automated portfolio trackers are so essential—they handle the number-crunching and keep things accurate without giving you a migraine.
Why Do Mutual Funds and ETFs Always Report TWR?
They use TWR because they have to. It's the industry standard mandated by the Global Investment Performance Standards (GIPS). This isn't just bureaucratic red tape; it ensures that performance reporting is fair, consistent, and transparent across the entire financial world.
Fund managers can't control when you or anyone else decides to buy or sell shares. So, TWR is the only metric that truly reflects how well their investment decisions paid off, creating an honest playing field for comparing different funds and their managers.
Ready to put all this knowledge to work and start earning without the hassle? Yield Seeker's AI finds the best stablecoin yields for you, handling all the complex tracking behind the scenes. You just focus on the returns. Start growing your capital with Yield Seeker today.